TL;DR
A PDF report shows everyone the same frozen page; an interactive report lets each reader chase their own question: filter to their region, sort by their metric, expand the part they care about. AI tools have made building the interactive kind a prompt instead of a project, so the real decision has moved to sharing: a PDF attaches to an email, while an interactive report is a small web app and needs a live link to travel.
What changed
Interactive reports aren't new; dashboards have existed for decades. What changed is who can make one. Producing a filterable, chart-rich report used to mean BI tooling and someone to operate it. Now you paste your numbers into Claude or ChatGPT, describe what you want, and get a working page: charts, toggles, filters (that HTML file, explained). The build cost collapsed to minutes.
Which exposes the second-order problem: the PDF had one unbeatable feature, effortless delivery. Everyone can open a PDF. Your interactive report is a web app, and web apps don't attach.
Where interactive genuinely beats the PDF
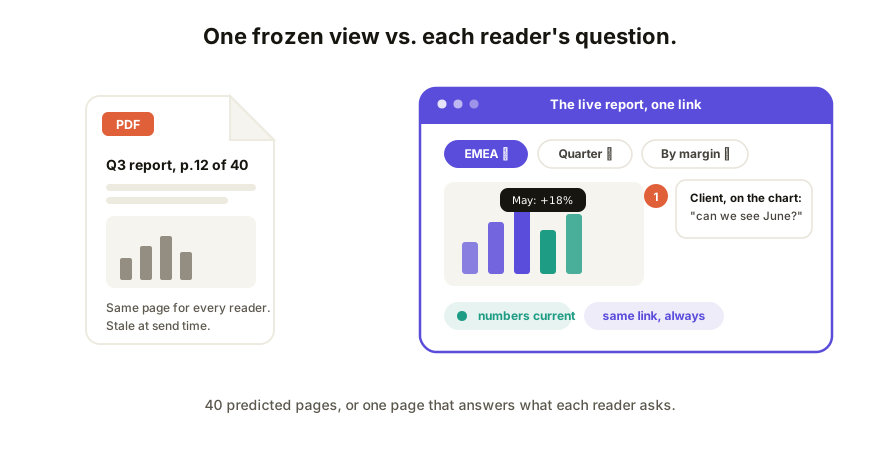
- Readers ask different questions. The CEO wants the trend, the regional lead wants her region, finance wants the outliers. A PDF answers one predicted question per page and balloons trying to predict them all; an interactive report is 40 fixed pages compressed into one adaptive one.
- The data will update. A PDF is stale at send time, and version 2 spawns "final_v2_REAL.pdf" in every inbox. A live report at a stable link updates in place; everyone's bookmark shows current numbers.
- You want engagement you can see. A link can tell you it was opened; an attachment vanishes into the void.
- Feedback is part of the point. On a live report, a comment can sit on the exact chart it's about instead of "page 12, the blue graph" in an email (how in-place commenting works).
Where the PDF still wins
Honesty earns the pitch: print workflows, regulatory submissions and archives (a frozen, signable artifact is the requirement), harsh-offline audiences, and true one-glance one-pagers where interactivity would be decoration. When "must look identical forever" is a feature, freeze it. Many teams land on both: the live report to work in, a PDF snapshot for the record.
How to actually share one
An interactive report is HTML, so the sharing rules for any AI-built page apply (the full comparison), compressed here:
- Don't email the file. HTML attachments get flagged, phones fumble them, and charts wired to separate assets arrive broken (why that happens).
- Give it a live link. Host it, or paste it into a collaboration tool. One URL, opens on any device, stays current as numbers change.
- Decide who can open it. Reports carry real numbers. A public URL is wrong for most of them; you want viewing that's effortless for invited readers and closed to everyone else.
- Let readers respond in place. The report is where the discussion should happen; comments pinned to charts beat a reply-all thread reconstructing page references.
How Coedit fits
Coedit is the delivery half of this workflow. Your AI builds the report; paste the HTML in (from Claude, ChatGPT, Gemini, or anywhere) and share one live link. Readers open it with no account and full interactivity, comments pin to the chart they're about, you can update the numbers and the same link serves the new version with a history behind it, and paid plans add invite-only access and your own domain for client-facing work. Coedit doesn't analyze your data or generate the report; it makes the one you built land like a deliverable instead of an attachment.
FAQ
Q: What's the advantage of an interactive report over a PDF? A: Each reader answers their own question: filter, sort, drill into what they care about, instead of everyone getting one frozen view. It also stays current at a stable link, while PDFs go stale the moment they're sent.
Q: How do I send someone an interactive report? A: As a link, not a file. Host the report's HTML, or publish it through a collaboration tool, and share the URL. It opens in any browser on any device, no software or account required of the reader.
Q: Can I control who sees an interactive report? A: Yes, if you share it through a tool with access controls: invite-only links, and viewing that needs no account for the people you've let in. A bare public URL, by contrast, is open to anyone who has it.
Q: Do clients need special software to use one? A: No. An interactive report is a web page; a browser is the software. That's what makes it deliverable to non-technical audiences in the first place.